It has been a while since I did not find time to write something in my blog, but this weekend I could arrange some time for my hobby to continue. Rather than jumping to technical jargons this time I want to write for “boring” CX metrics. Believe me, “CX Metrics” give more exciting insights than what most of us think.
Before moving forward with directly CX Metrics itself, let me give an assumed example:
Sample assumption:
- We built Company X and started to provide an education service. This education company has a website, application and customer service. All modern systems, whiteboards, online education platforms etc.
Key question: How will we understand if everything is going well with our customers in the business?
Answer: Measure Customer Experience and Manage It!
- Customer Experience: as the name suggests, it is the feeling and experience by customers when they interact with our Company X services and products. Any single interaction and touchpoints are considered under the Customer Experience umbrella. And just note here, the abbreviated version of Customer Experience is generally known as CX. Below we may find just a few examples of touchpoints:
- Company website and mobile application (e.g., user friendly and updated information)
- Customer related processes (e.g., easy and fast service ordering)
- Customer service agents (e.g., supportive agents)
- Contact details (e.g., is our company reachable and responsive)
and many other
- Management of Customer Experience (CXM or CEM): is a strategy and a methodology and should be tailored to the company’s goals with following accepted metrics and principles. Sometimes CXM and CEM are used as interchangeable but sometimes both have slightly different views. But regardless of abbreviations, both are for managing customer’s experience to improve or exceed it.
- CX Metrics: most of us know how much fuel our car uses, or we know how much electricity we consume at home. And based on that we take actions. So, we have some metrics, it is same concept here in CXM. We have metrics where are measured in touchpoints. As I am a telecom expert, here I will focus on CX Metrics for Telecommunications only, but most of them are relevant for other industries too. Two kinds of categories we have CX Metrics in Telecom:
- Inside-out CX Metrics (observation and analysis-based metrics from a network perspective, for example CEI, SQI etc.)
- Outside-in CX Metrics (customer survey-based metrics from customers’ perspectives, for example NPS®, CSAT etc.)
Both inputs are bricks of Customer Experience Management, but it does not mean both inputs reflect each other smoothly all the time but certainly solidly related.
The CX Metrics are not limited only to what will be talked about here, but I will try to go through with the most well-known and important ones. Any Medical industry, Hotel industry, Textile industry or Tobacco industry, Telecommunications industry and literally any industry must have CX Metrics and management strategy. Even though historically companies used different methodologies to provide better service to customers, Customer Experience appeared on stage starting from 1980s-1990s and especially in Telecommunications industry it started to be used mostly in early 2000s. Of course, even before the 1980s similar concepts were used by many companies but not necessarily to be the term as Customer Experience.
Mostly known fact is Disney started to focus on CX if we want to understand the beginning of CXM history, was highly involved in creating a holistic customer journey – from the park’s design to the guest interactions with staff. This level of attention to every detail laid the groundwork for what would later be known as CX. We may look at the book “Be Our Guest: Perfecting the Art of Customer Service” by Disney Institute for CXM baby steps as they understood the importance at that time.
So, let’s go now to the topic. Below we will go most legacy and modern CX metrics:
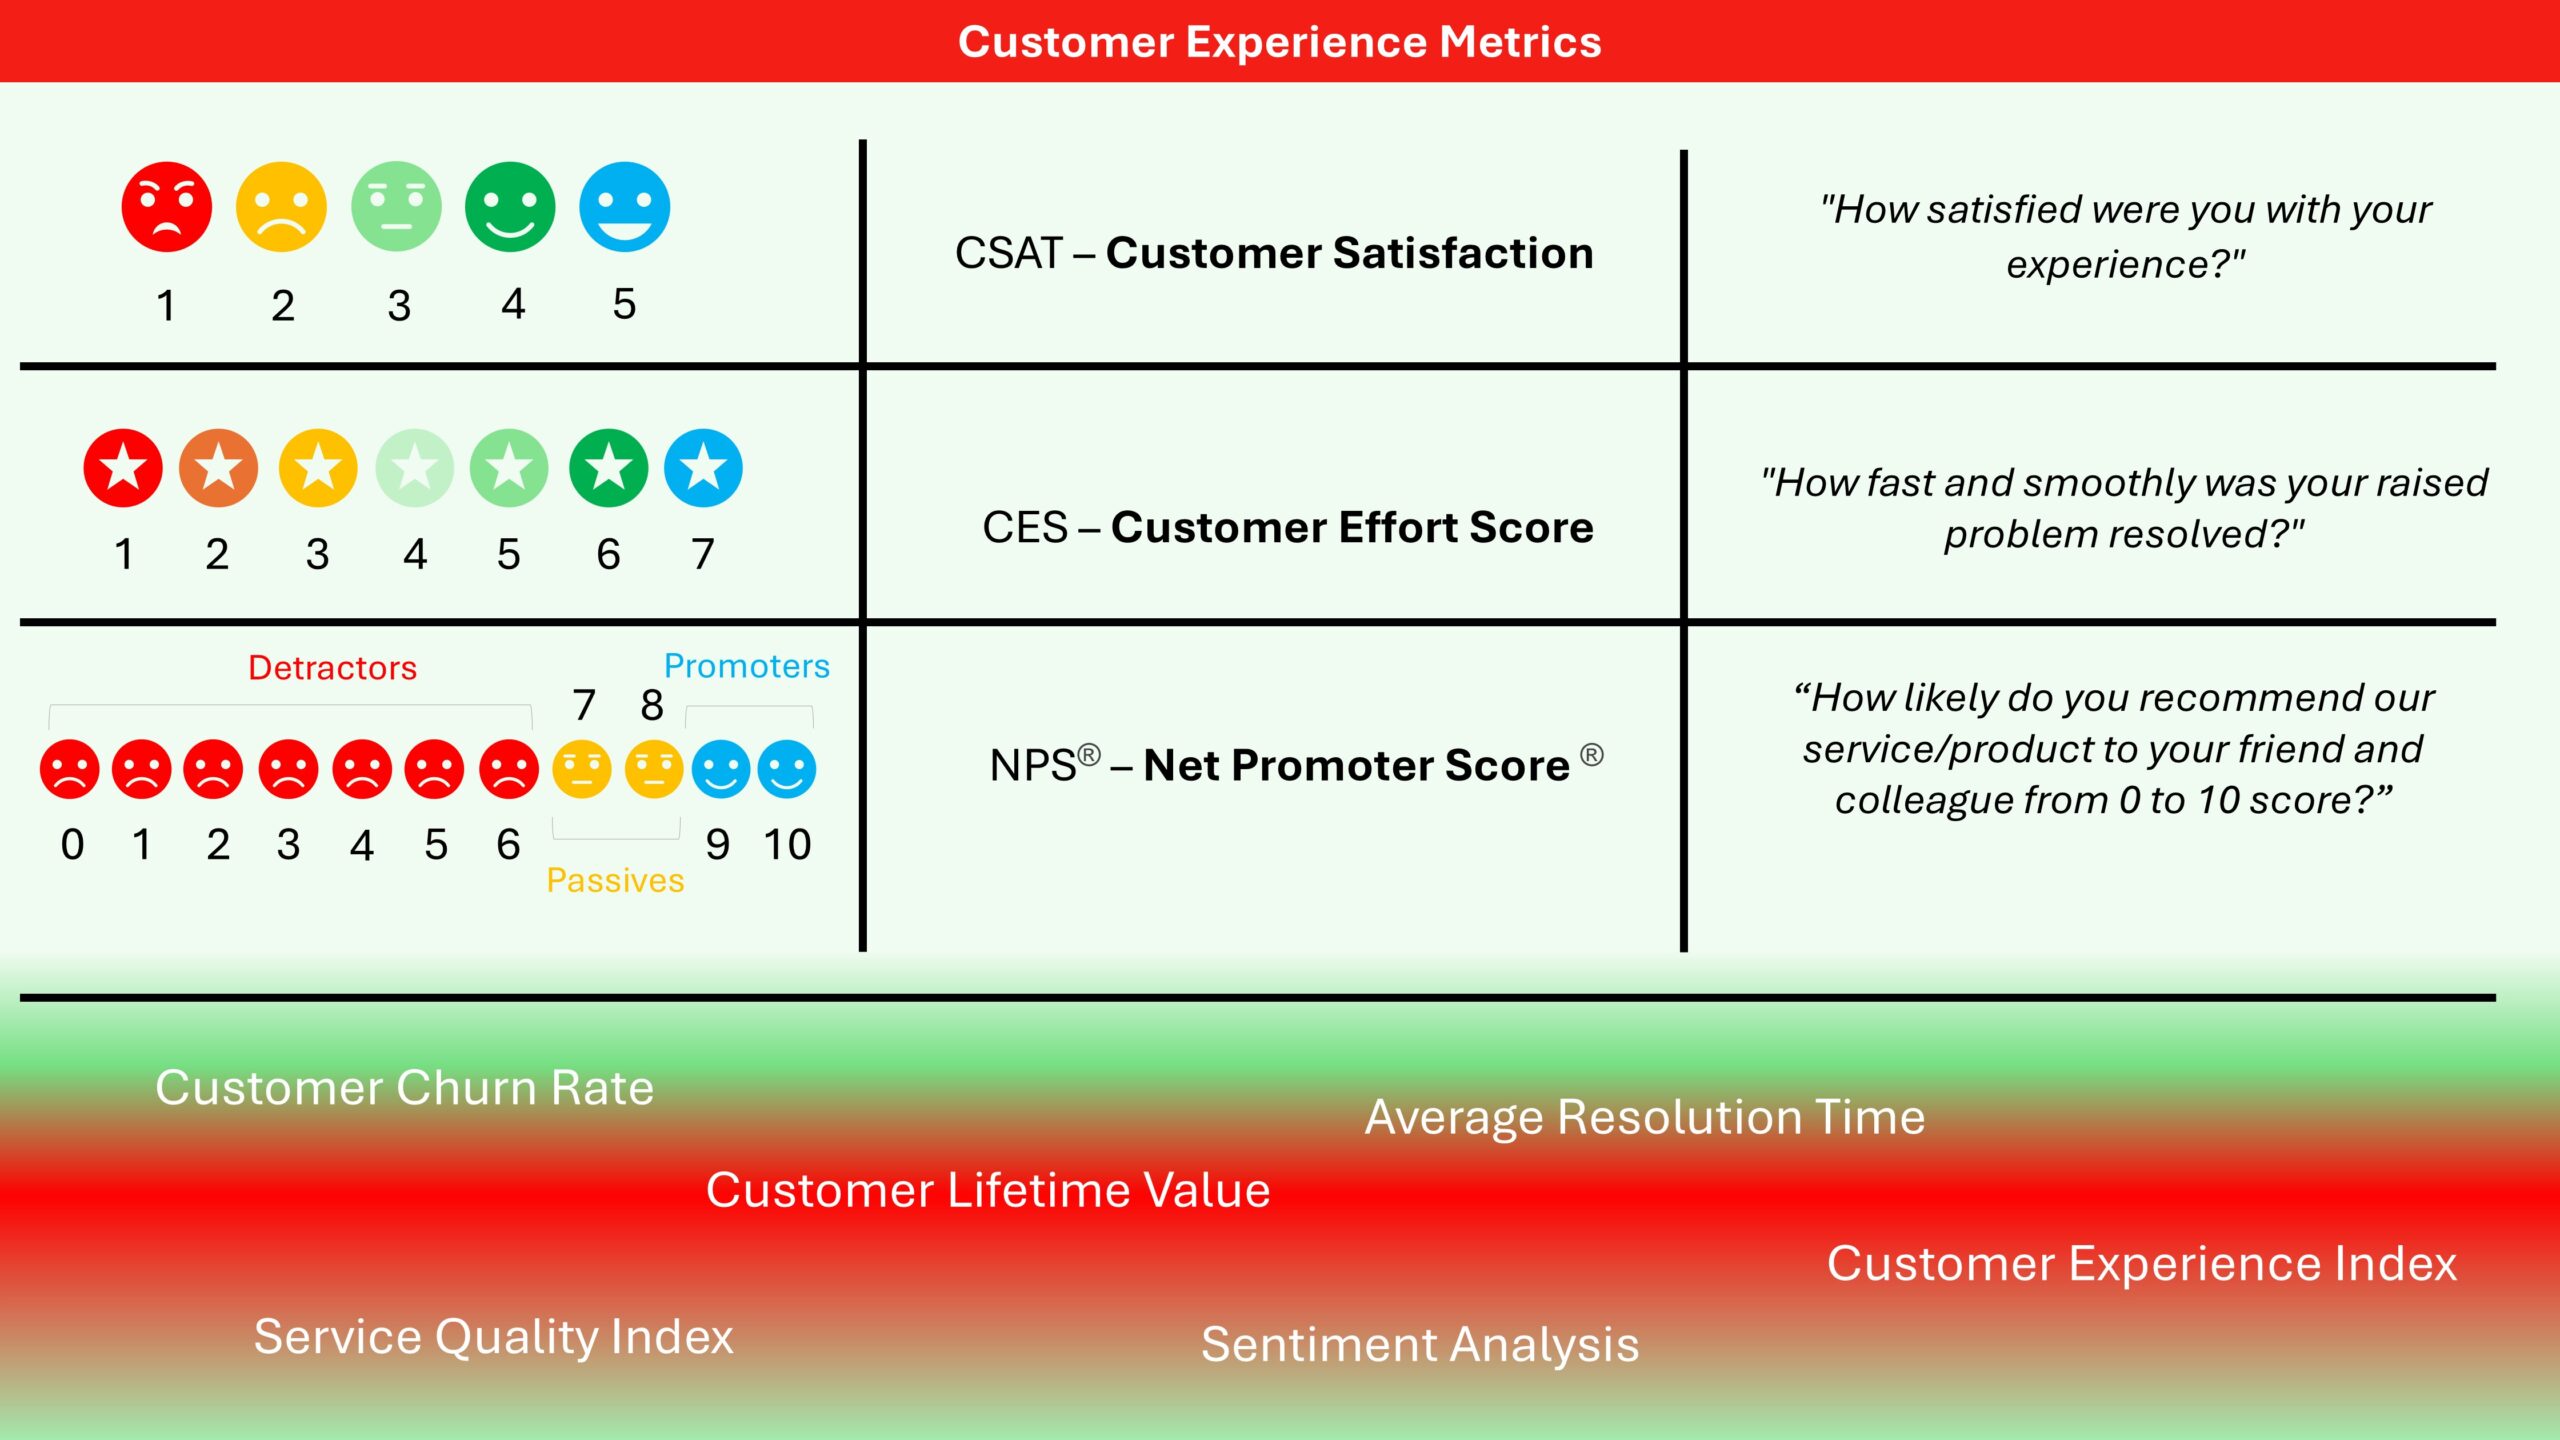
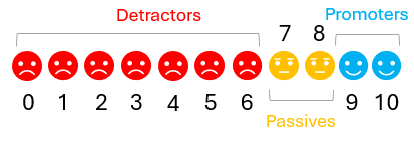
- CSAT – Customer Satisfaction CX Metric
It is basically calculated between number 1 and 5 with this typical question after providing a service as a survey question below. It could be online like a pop-up message after a service delivery in mobile application or in a store like a small screen with 5 emojis etc.
“How satisfied were you with your experience?”
1 – Very unsatisfied
2 – Unsatisfied
3 – Neutral
4 – Satisfied
5 – Very satisfied
Formula:
CSAT = (Number of Satisfied Customers / Total Number of Survey Responses) × 100%
Example:
1 – Very unsatisfied (3 customers)
2 – Unsatisfied (6 customers)
3 – Neutral (5 customers)
4 – Satisfied (20 customers)
5 – Very satisfied (22 customers)
CSAT = (20+22) / (22 + 20 + 5 + 6 + 3) × 100% = 75%
Most probably a question will raise in our mind after calculation like “is that a good or bad value?”. There is no direct answer for that as it depends on company strategy, even though usually more than 80% is considered as an excellent value but targets depend on final goals for each company and industry. Another crucial point to consider, all surveys where customers make selection depends on their emotions, feelings and decisions. One customer may consider same level of service delivery 5 but other not patient customer may select 3.
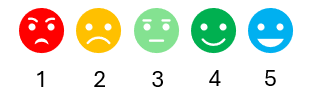
- CES – Customer Effort Score CX Metric
It is another important metric in Customer Experience Management which measures how much efforts customers make to order a service, to purchase a product or to resolve an issue. Usually, the customers do not care about how much the processes are complicated or fascinated, well or bad designed. They care about how fast they will be able to achieve their wish.
A small sidenote: I am a frequent user of Amazon last ten years, that is a fantastic experience I have so far at least and now I see their CES is 6.3 which was an expected result. Of course, we cannot compare it with Telecommunications which has own challenges.
Below is a typical question in survey is presented to customers after resolving an issue:
“How fast and smoothly was your raised problem resolved?”
1 – Nearly impossible
2 – Very hard
3 – Somewhat hard
4 – Moderate effort
5 – Fairly simple
6 – Simple
7 – Very easy
There is no strict rule in the formula of CES, some companies use number range (1-7), some use (1-5) or even (1-10). And even naming could also be different, like in this example we mentioned 7 – Very easy but it could also be tagged as opposite.
Formula:
CES = (Number of Weighted Responses / Total Number of Survey Responses)
Example:
We received 250 survey responses
1 – selected by 12 customers
2 – selected by 15 customers
3 – selected by 18 customers
4 – selected by 19 customers
5 – selected by 39 customers
6 – selected by 89 customers
7 – selected by 58 customers
CES = (1×12 + 2×15 + 3×18 + 4×19 + 5×39 + 6×89 + 7×58) / 250 = 5.2
Generally, CES value less 6 is considered a bit poor and need some improvement plan in 7 scale CES.
Less efforts and easy reaching to the provided service mean the company focuses on CES, otherwise bureaucracy and complexity is not the way of good service delivery.
Typical examples:
We want to order an eSIM:
- Visited website, fill major information and make payment. Then Boom: eSIM QR Code is ready to scan via email or portal itself in a few minutes.
- You encountered a problem with eSIM profile, visit company application to get in touch with an agent. If AI powered agents cannot help, then it should easily direct to real human support rather than asking not related questions.
Both are typical cases will definitely be reflected in a good result in CES with surveys.
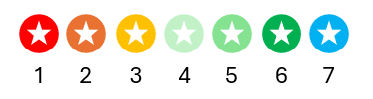
- NPS® – Net Promoter Score® CX Metric
This is very well known and widely used by almost all industries over last two decades, it reflects net how much promoters are in your business after extracting detractors.
NPS® has a range from 0 to 10.
- Promoters (Score 9-10)
- Passives (Score 7-8)
- Detractors (Score 0-6)
If the customers selected 9 or 10 in your NPS® survey, these are mostly loyal customers and have high potential to re-purchase your services/products or positively recommend to others.
If the customers selected 7 or 8 in the NPS® survey, these are mostly satisfied customers but not willing to promote your service/product to others, even easily may move to other company services.
If the customers picked up one of these numbers between 0 and 6 then that is not a good signal, as these customers will do most potentially negative reviews and opinions about your brand, service or product in all possible platforms.
This is a typical NPS® survey question is asked to vote:
“How likely do you recommend our service/product to your friend and colleague from 0 to 10 score?”
Formula:
NPS = %Promoters – %Detractors
Example:
We received 100 survey responses
- Promoters (Score 9-10) selected by 38 customers
- Passives (Score 7-8) selected by 12 customers
- Detractors (Score 0-6) selected by 50 customers
Promoters = (38 / 100) x 100% = 38%
Passives = (12 / 100) x 100% = 12%
Detractors = (50 / 100) x 100% = 50%
In this example NPS Score = 38% – 50% = -12
Is that good or bad NPS® value? Negative NPS® value is giving warning signal that there are more Detractors than Promoters which is risk for the business and need urgent action.
- ART – Average Resolution Time CX Metric
This is a generic CX Metric, but also useful to have insight in which speed the open cases are resolved. Example, a Call Agent received 5 cases per day from multiple customers and below is the resolution duration per case:
Case 1 = 16 min
Case 2 = 30 min
Case 3 = 18 min
Case 4 = 6 min
Case 5 = 12 min
ART = (16 + 30 + 18 + 6 + 12) / 5 = 16.4 min
There cannot be strict bad or good values for ART, because it is internal decision of each company based on strategies and business goals. It could be a technical issue resolution or just query and answers or totally different resolution item.
- CLV – Customer Lifetime Value CX Metric
Typical reason of having a business is to revenue if it is not a governmental project or non-profit organisation or similar. And businesses need to find strategies to bring customers and hold them for long periods of time. But is that enough? Short answer no, because just having a customer is not sufficient to gain revenue but need to measure of the Customer Lifetime Value. The aim to understand how much value the customer is adding to the business:
Formula:
CLV = (Revenue from a customer per year) x (Relationship with the customer in years) – total costs spent for the customer (acquisitions costs, operational costs, service costs etc.)
It is simplified and generic formula to calculate the CLV, but just a reminder that like CLV many other CX Metrics could be adapted and customized based on a business model and targets.
- CCR – Customer Churn Rate CX Metric
Customer Churn Rate, which is normal for any business, but once it increases beyond threshold then could be a nightmare for any business, because the customers stop temporarily or permanently to use the services. Cancelling the contract, suspending or stopping the subscriptions etc. The consequences are very obvious from financial point of view. The general formula to calculate CCR is very simple unless there is customized formula used by any other company. Here it is:
Formula:
CCR = Customers lost during the period / Customers at the start of the period
Example:
The customers at the start of the period: 1200
The same customers lost during the period: 89
CCR = (89 / 1200) x 100% = 7.4%
This is very simplified version of CCR, of course if new customers arrived in the middle of year and left after some time, they may also be considered but the formula may be adjusted.
Most important to find out is root cause of high Churn Rate, there could be tons of reasons or just few. Right understanding and identifying the underlaying problem and utilizing the CX Metrics are the fundamentals. That is why, each CX Metric has own value and direct relation with CCR.
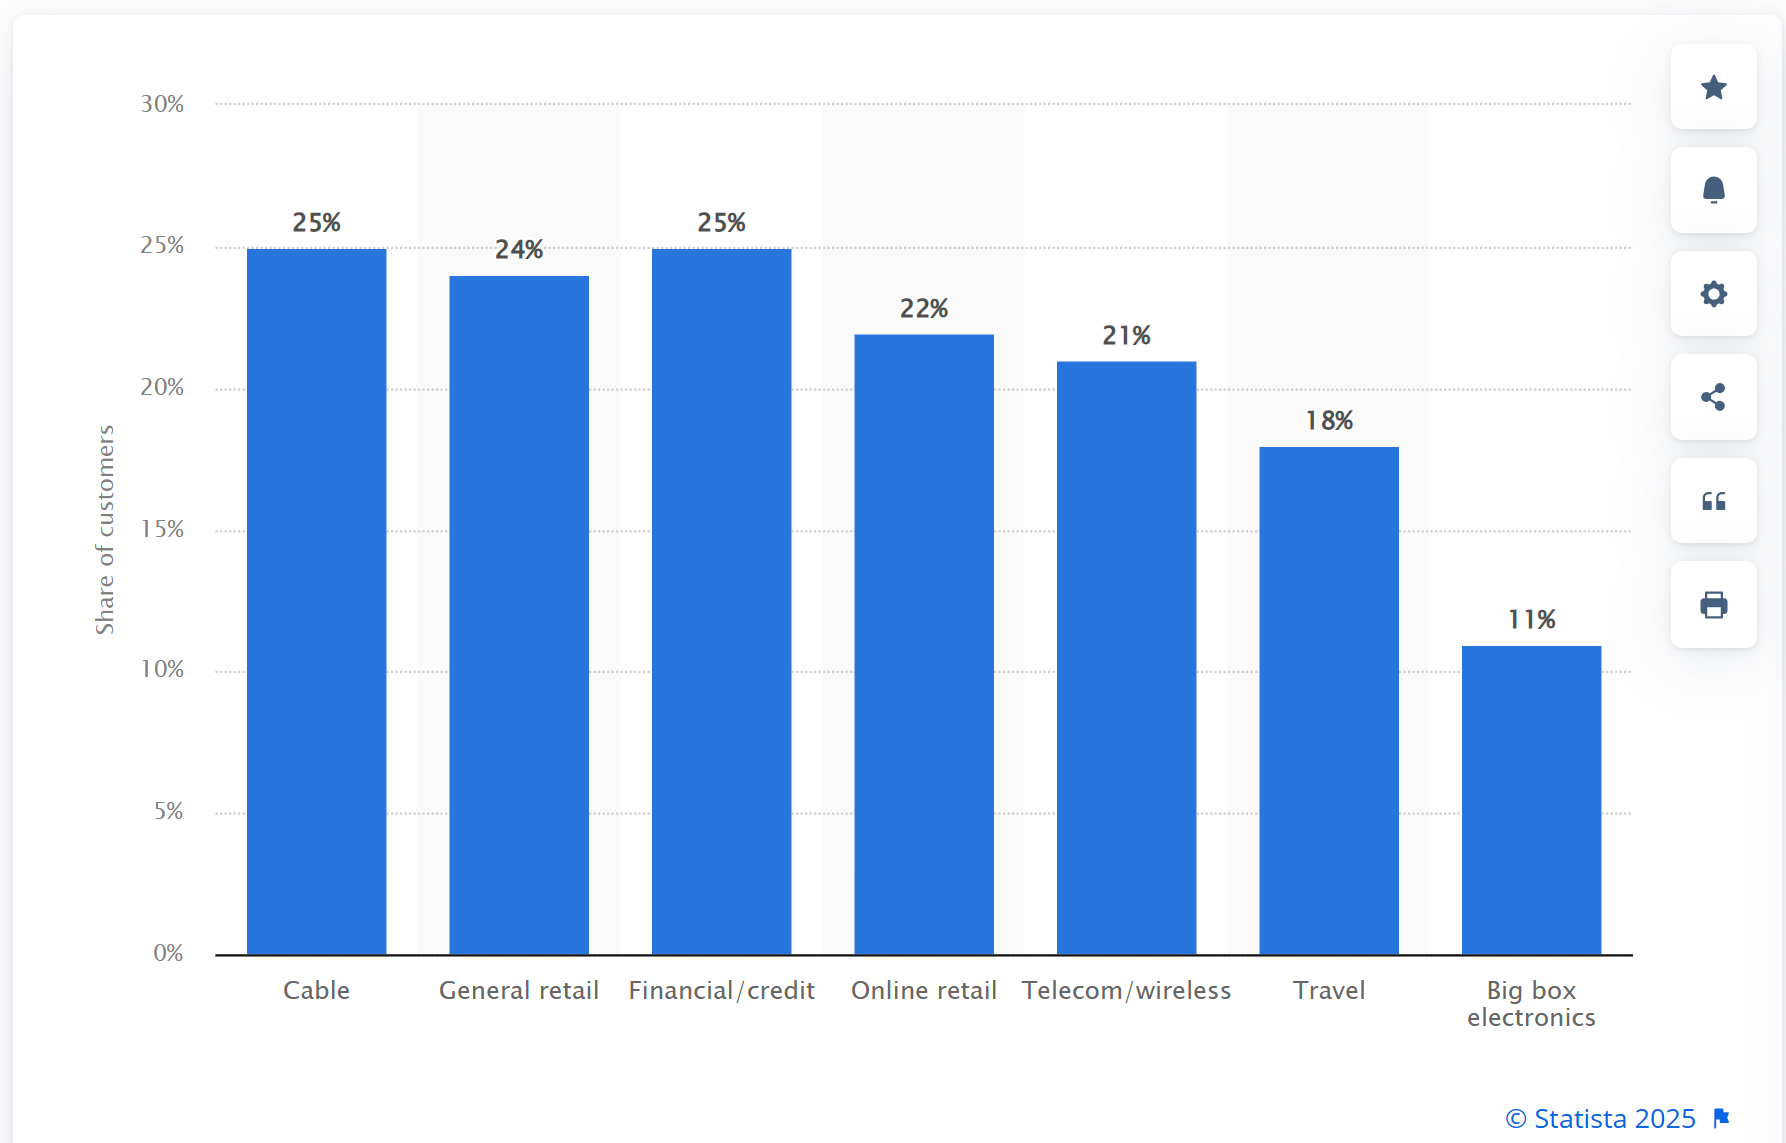
Each industry has different acceptable churn rate, in Telecommunications generally annualized CCR it is 15%-20% if there are high competition. Below example is from US for different industries from Statista Inc. in 2020:
Customer churn rate in the United States in 2020, by industry
- CEI – Customer Experience Index CX Metric
This is another CX Metric but not limited with telecom industry, it can be utilized and adapted, implemented in any industry for customers. The CEI may consists of few sub-indicators, or even more like tens, hundreds which depends on company strategy. Generally, in telecommunications the mobile operators use CEI to reflect individual user experience from network perspective and majority of these data are derived from either billing systems, operation tools or probing solutions (e.g., Huawei SmartCare, Radcom, Anritsu, Veego, Elisa Polystar and several others).
Example:
- Voice (e.g., quality, call drop, call success, call setup time etc.)
- Video (e.g., video resolution, time to play, buffering etc.)
- Data (e.g., packet loss, latency etc.)
- SMS (e.g., delivery success rate, delivery delay etc.)
These sub-KPIs could be weighted and normalized to percentage units. But just a small reminder, there are no any written-on-stone rules how to build the CEI similar like most other CX Metrics. It can be less or more sub-KPIs under CEI. Each sub-KPI means Key Performance Indicators (e.g., for Data these are packet loss, latency etc.).
- SQI – Service Quality Index CX Metric
SQI is very complex in CX Metric bucket and closely linked into network operations. Generally, SQI is reflecting Measurement of Service Quality which can encompasses network availability, incident resolution speed, service outage and even under SQI coverage area we can add device level insights like how the Apple handsets are performing in comparison with Samsung or Huawei handsets etc.
As a metric the SQI could be weighted and normalized similar like CEI, from concepts perspective but of course values and thresholds could be totally different.
- Sentiment Analysis – finally CX Metric in this article
Most of the above CX Metrics have been used in telecoms for almost decades but still will be part of CEM (Customer Experience Management) for upcoming decades with optimized and modernized versions. But recently Sentiment Analysis became more prominent and completed CX Metrics with advanced technologies, AI and Big data. Basically, if customers are not happy with the provided services they may post and share experiences, emotions over social networks like X (former Twitter), Facebook or Google Review etc. And Sentiment Analysis algorithms will catch these angers, feelings and notes to give automatically priceless insights to see and to take actions. Of course, there are a lot of challenges for reliability of these data, but it is a valuable insight input for a brand image.